Water Profile for Brewing in Boulder, Colorado
See also Water Profile for Brewing in Mountain View, California.
Introduction
Some homebrewers go to considerable lengths to fine tune the mineral content of their water. I am not an expert in either brewing or water chemistry and will not express an opinion for now on whether that effort is worthwhile since I have yet to do any experiments of my own. I was however interested to know what my water is like with an interest of possibly experimenting on how it affects my beer in the future. It is all very well getting a precise lab analysis done on the tap water, but how much does it change day to day and for how long is that analysis going to be valid?
My local water provider (Boulder Water Utilities Division) provides a leaflet with a summary of typical water quality. Basically it is very good and I have no concerns about using it for my brewing (or drinking!). One interesting feature though is that I am served with water drawn from three distinctly different sources. Table 1 contains the numbers taken from their publication of the typical or average water from each source.
| Compound | Betasso | Feeder Canal | Reservoir |
|---|---|---|---|
| Alkalinity (total as CaCO3) |
45 | 31 | 65 (24-112) |
| Hardness (total as CaCO3) |
57 | 36 | 144 (31-167) |
| Calcium (as CaCO3) |
50 | 28 | 90 (20-115) |
| Magnesium (as CaCO3) |
7 | 8 | 54 (33-71) |
| Sulphate | 7 | 9 | 76 (5-100) |
| Chloride | 3 | 10 | 15 |
| Sodium | 3 | 13 | 16 (10-18) |
| Iron | <0.04 | <0.04 | <0.04 |
| Nitrate | <0.1 | <0.2 | <0.1 |
| Potassium | 0.4 | 0.7 | 1.1 |
| Total dissolved solids | 71 | 85 | 207 (60-282) |
Some of the ions that a reputed to affect beer flavours differ by almost a factor of ten between the three water sources so can I make my own measurements to determine where my water is coming from on any given brew day? It should be stressed that as far as beer brewing is concerned, none of this looks terribly important as a practical concern. The water profile is pretty benign so in fact whichever source is being used, adding a little calcium and maybe some sulphate is probably all that is really required. As I say above, I have not yet run the experiments to convince myself that precise control of these parameters is significant.
Measuring Hardness & Alkalinity
If you are serious enough about this, most of the above ions can be measured with relatively simple experiments though assembling all the required reagents and equipment could get a little expensive. Thanks to the domestic aquarium market, there are accurate and cheap test kits available for determining water hardness based on EDTA titration. The definition of 'Alkalinity' in this context is simply the quantity of acid required to reduce the pH to a certain value, so that is also ideally suited to a titration or drop count test. These are therefore the parameters I have chosen to monitor. The drop count kit I am using is the "API GH & KH Test Kit" (retail link), widely available, at least in the USA, and gives values for "Total Hardness" (GH) and "Alkalinity" (KH). As provided by the manufacturer the instructions suggest testing 5ml of water and give a resolution of 17.9 mg/l. Inspecting the table above, the supplies I am trying to distinguish differ by about 15 mg/l, so I am testing larger samples. For example, with 25ml water samples I have a resolution of 17.9 / 5 = 3.6 mg/l. This uses up the reagents more quickly, but since my water is fairly soft I should have enough in a single packet for about a year of weekly tests.
Testing the Test Kit
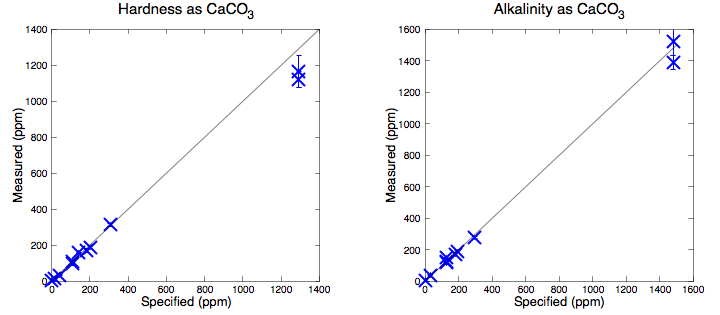
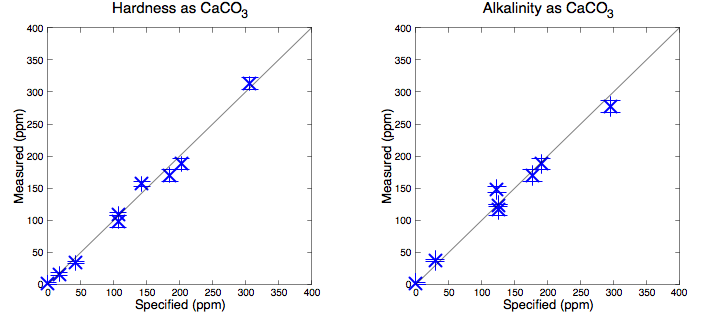
First task is proving the test kit works and that I will be able to distinguish between different water samples when they do change. This was probably best done by making up my own test samples from distilled water with added known concentrations of ions. However it seemed much more fun to go to the supermarket and buy one bottle of every brand of mineral water they had. I then tested each water and compared to the "typical analysis" information panel that appears on the label. The water brands I found are a generic distilled water, Voss, Eldorado Springs, Fiji, Highland Spring, Oakley, Mountain Valley, Evian and Gerolsteiner. (Why can I buy water from almost every corner of the planet in my local supermarket?) In Figure 1 I plot hardness and alkalinity measurements compared to the specification either on the bottle or manufacturer's website. The quoted "typical" analysis is not guaranteed in any particular bottle but the correlation is impressive showing that the basic idea does work. I should be able to tell when my tap water switches supply. Throughout, I use the sum of calcium and magnesium as 'hardness'. Where it is quoted I have ignored potassium whose values were always an order of magnitude smaller.
Results on Tap Water
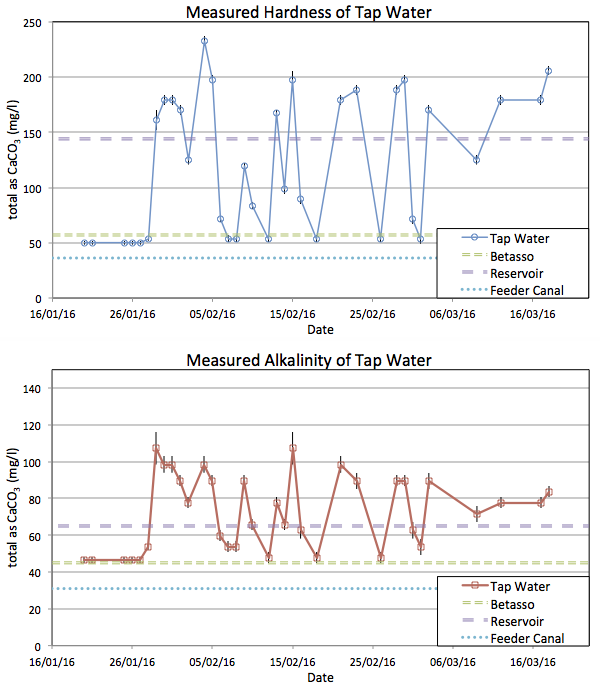
Figure 2 shows the measurements of my tap water. I have no idea what would be considered normal for a public water supply, but I am surprised how variable it proves to be. Seeing these data it would seem reasonable to suggest the test is unreliable, but repeated measurements of the fixed water samples in Figure 1 show it is actually very accurate.
Conclusion
Yes, I can distinguish between water from the various sources and if I am so inclined can then modify the water accordingly for brewing. As you would expect, a distinct change in taste accompanied the large step change in hardness.
The general report published by the water supplier was a very good general guide but obviously not precise at the ±10% level. It is amply good enough to guide you to the kinds of adjustments that might be required but there is no point trying to use it to fine tune some specific water profile in great detail.
Even if I paid for a professional lab report on my water, the Ca+, Mg2+, and bicarbonate levels are varying day-to-day by a factor of three, so again, fine tuning profiles seems a pointless exercise without testing the water myself on brew day. Depending on your local supply, a one-off laboratory test may not be enough to tell you about your long term supply. I do not know how unusual it is that at a single address I am served from three distinctly different supplies.
Some reservoirs are very stable and some vary a lot. During the first week of the experiment the Boulder Reservoir processing plant was offline and I know water was coming only from Betasso. Every data point was identical during that time. The Boulder reservoir water however seems much more variable, just as the Utility's leaflet warned. I suspect what I am actually seeing here is that I am receiving a mixture in varying proportions from the city's two water processing plants.
2016-03-13 5:06 PM
Update: 2016-08-16
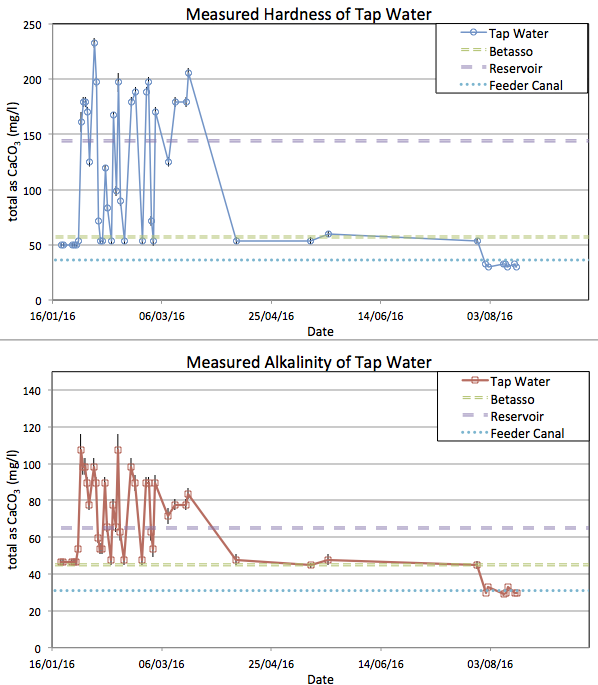
Guidance from the local water company said to expect the water to change again in late Summer when my area starts drawing water from the Feeder Canal. The following plot shows this. The water has now been very soft for a couple of weeks and closely matches the published values for the Canal. Just like when we were being fed from Betasso, the values look very stable day to day. As long as the water is coming from a single source, it seems constant. I surmise the wildly varying mineral content in the Spring was caused by different mixing of water from the two water plants depending on local demand. So, again I conclude that a detailed lab report on a one-off water sample has little long term value.
2020-07-12 4:53 PM
If you have comments or suggestions feel free to contact me: