The afternoon session of Jul 25th of the Pluto Science Conference started with John Stansberry’s (STScI) talk entitled “Interactions between Pluto’s Surface and Atmosphere.” He stated, “The similarities between Pluto and Triton are remarkable.”
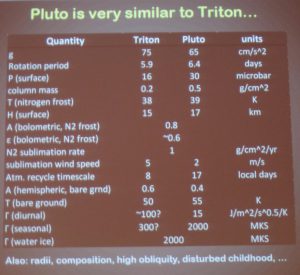
The main properties of Pluto and Neptune’s moon Triton are summarized above.
Pluto has a volatile-rich atmosphere (N2, CO, CH4) and interacts with the surface to bring about mass and energy exchange. N2 dominates the surface ices and the atmosphere. N2 is also globally much at the same temperature mainly due to N2’s large latent heat of sublimation that balances out changes in temperature. To probe deeper at surface-atmosphere interactions, he looked specifically at the methane to nitrogen mixing ratio (abundance of one component of a mixture relative to that of all other components). But there are many open mysteries about surface-atmosphere interactions.
Overabundance of Methane Mystery. Pluto’s upper atmosphere has X_CH4 ~0.5% (X_CH4 is the methane mixing ratio) based on occultation measurements. Infrared spectral measurements (Jason Cook et al 2007) from the lower atmosphere derive a much higher X_CH4 ~ 4%. Surfaces models for the N2+CH4 ice predict X_CH4 ~0.5%. So in order to explain the overabundance of methane in Pluto’s lower atmosphere, two models were introduced to help provide additional sources of methane. This is an active area of study.
Changing Atmospheric Structure. Stepping through the light curve changes shown by Mike Pearson (see previous blog entry) there is something changing the structure of the atmosphere at ~1200 km. Comparing 1988 (equinox) and 2006 (N mid-Spring; Northern ) could be explained partially by geometry changes. Not all the changes are understood.
Pluto’s lower atmosphere is a mystery. We can probe down to the stratosphere with occultation measurements (scale height 50 km). So below 50km they need to resort to models.
Other influences on surface-atmosphere interaction included effects due to topography and winds. Winds have been observed on Triton (Hansen et al 1990).
Predictions for New Horizons. X_CH4 will be ~0.5% in stratosphere, a few % in troposphere. For the atmosphere structure he predicts r_tropopause = 1185 km, h_tropopause = 10km, r_atmosphere_base = 1200km, weak inversion, and bottom of atmosphere at r=1175 km, pressure at surface > 15 microbar. Winds will be Triton-like. A bright north polar cap. Potentially morning frosts.
Bonnie Buratti (JPL) presented a talk on “Pluto’s Light Curve over Time as an Indication of Seasonal Volatile Transport.” They are looking at historical light curves, plus new ones and fit with a fixed frost model. Changes in light curves tell you about the albedo (reflectance) of the surface. You do need to do a correction to phase angle because of Pluto’s high obliquity. They do find the data over 2012-2013 consistent with a constant frost model. She showed the data of long-term monitoring of Triton and it indicated a volatile change and they got HST imaging data which when compared with the Voyager fly-by they did see that areas of high albedo got dark and others got brighter, supporting their interpretation of the light curve approach. They really need to get a good light curve prior to New Horizons’ 2015 fly-by encounter.
Erin George (University of Colorado), working with Marc Buie (SwRI) in “Pluto Light Curve in 2010,” described her work in analyzing data from Lowell Observatory over 2007-2013. The challenge had been to find stars to use as relative flux calibrators that were well separated. They also used a technique to remove the template of background stars (eliminate field confusion).
Marc Buie (SwRI) next took us on a tour of “Seasonal Variations on the Surface of Pluto.” He reports on visible (B & V filters) photometry from data taken with photographic plate, photoelectric detectors, and CCDs from 1954-2010. All the measurements are of “Pluto+Charon” as the two bodies are not resolved from the ground for the majority of this data (large pixels). He showed the trend of the light curve which indicates that “something happened in 1992” (he hypothesizes it occurred very fast) to change the “color” of Pluto because the light curves in B & V passbands deviate. He’s working towards removing Charon from the data using a model for its brightness from his HST data.
Leslie Young (SwRI) presented a talk on “Modeling Pluto’s Diurnal and Seasonal 3-Dimensional Volatile Transport with VT3D. ” She asks, “Why should we care about volatile transport?” Three key reasons: (1) Mobile volatiles control the surface appearance (albedo, composition), (2) Volatile transport depends on the hidden subsurface (thermal properties, depth of volatile deposits), and (3) Volatile transport models can predict atmospheric behavior at other times (escape rates, atmospheric chemistry, winds).
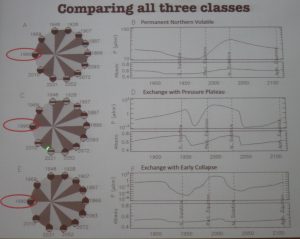
Her new code, VT3D, uses physics from standard volatile transport models (Hansen & Paige, Spencer & Moore). She has been validating it against other codes. Types of parameters that she investigated in her code are emissivities, thermal inertia, albedo, and nitrogen abundances. She found her results clumped into three categories, atmospheres characterized by: (1) Permanent Northern Volatiles, (2) Exchange with Pressure Plateau, and (3) Exchange with Early Collapse.
A description of her model can be found in L. Young (2013) http://arxiv.org/abs/1210.7778.
Her model fails to predict a bright south pole seen in the 1990-1994. But then she counters, could that be possible because it’s covered with bright CH4 frost?
Three classes of atmosphere models from Leslie Young (2013). The graphs are the surface albedo and the pressure at 1175km in u=microbars vs. time. The time runs from 1866 to 2116, a full Pluto year about the Sun. The seasons on Pluto are shown with the vertical lines and the equinox in 1990 is highlight with the circle.
To learn more about Pluto’s seasons check out this blog from the Planetary Society http://www.planetary.org/blogs/emily-lakdawalla/2013/05021212-plutos-seasons-new-horizons.html.
Candy Hansen (PSI) described her model in her talk entitled “Pluto’s Climate Modeled with New Observational Constraints.” She described her model, HP96, named after Candy Hansen and her collaborator Dave Paige, which was coded in 1996. She showed an output of the model for Pluto from 1000 to 2100 AD, over a good four Pluto-orbits about the sun. The model now has been updated to address new knowledge learned about the Pluto system. To derive solutions that do not have a zonal band (an observable characterized by sharing a range of latitude, appearing as a ‘band’), eliminates high thermal inertia cases, cold frosts and large abundances of N2. The model does meet constraints from the observed albedo. She does not include an atmosphere in her model, so she is excluding wind and other atmosphere layer issues. After seeing the data from the May 2013 occultation presented at this meeting on Tuesday made her change her models and she presented a true “hot off the press” new result today. Predictions for New Horizons. 2.4 Pascals at the surface at the time of the New Horizons fly-by.
As a closing comment during the discussion session, Rick Binzel is hopeful that Charon-illuminated image of Pluto’s south pole during the New Horizons fly by will be a key to helping understand what may be going on at Pluto’s south pole!
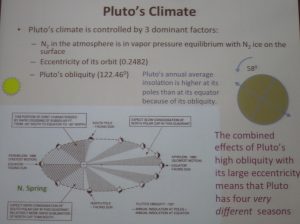
A nice summary of seasons of Pluto. Since the 1950s we are seeing more of Pluto’s northern hemisphere. We are in Pluto’s northern spring time right now.
Laurence Trafton (University of Texas) gave a talk on “Driving Seasonal Sublimation and Deposition on Pluto-Uncertainties in Evaluating the Vapor Pressure.” Pluto’s atmosphere is supported by the vapor pressure of its surface ice. For most models, N2, CH4, and CO are assumed to exist solely in solid solution on Pluto’s surface, and are well mixed in atmosphere. However, this did not explain the mystery of Pluto’s elevated atmosphere CH4 amounts (seeabove talk by Stansberry). Two models were suggested: “Detailed balancing model” (DBM) (Trafton 1990) and the “Hot CH4 Patch Model” (Stansberry et al 1996). The latter only needs 1-3% of Pluto’s surface to have this extra source of CH4. Neither model can explain widespread pure CH4 ice hypothesized to be on Pluto’s surface. He is in need of lab experiments to establish vapor pressures for the saturated areas of the phase diagram.
Tim Michaels (SETI) spoke about “Global Surface Atmosphere Interactions on Pluto. ” He is using the OLAM (Ocean Land Atmosphere Model, Wakko and Avissar, 2008) model. He is using the Northern summer in 21st century convention (which is the IAU/Ecliptic North coordinate system). Their approach stats with a simple surface nitrogen ice model (no methane). When run for 1990 and 2015, they show distinctly different trends. Next steps are to add albedo distribution, methane cycle, and gravity changes. This is a rich atmosphere-surface system.
Kevin Baines (University of Wisconsin-Madison) spoke about “Chemistry in Pluto’s Atmosphere and Surface: Predictions of Trace Aerosol and Surface Composition, and a Potential Geologic Chronometer.” There are many sources that drive atmosphere surface chemistry and albedo. For example, volatile transport dominates on days, months, and year timescales. There is UV photochemistry (decade timescale) in this rich atmosphere. Hydrocarbons could be raining out 1mm every 50,000 years. Solar wind and accretion activities (impacts, dust from satellites or KBOs) occur in 1Myr timescales. So, he asked, “What would Galactic Cosmic Rays(GCR) do?“ The types of products by irradiation from CGRs include CH4, CnH2n+2, C6H10, NH3, HCN, etc. over 5-20 Myr. And he proposes they may be viewable by darkening on airless KBOs.
Vladimir Krasnopolsky spoke on “Pluto’s Photochemistry: Comparison with Titan and Triton.” There are three bodies with N2/CH4 atmospheres in the solar system: Titan (moon of Saturn), Triton (moon of Neptune), and Pluto. He proposes that Titan is a better analog to Pluto rather than Triton. He presented the main results of his Pluto Model (Krasnopolsky & Cruikshank 1999). He observed Pluto with HST in the UV 180-256nm and was able to fit molecular species predicted by his model and saw no albedo changes from his predictions (Krasnopolsky 2001). New Horizons data will provide useful information to update their photochemical model.
Francois Forget (CNRS, Paris, France) closed the day with “3D Modeling of the Methane Cycle on Pluto). He presented the LMD Pluto Global climate model. Their model does include the methane cycle, but they are neglecting microphysics of N2-CH4. They assume the terrain description of Pluto from Lellouch et al 2000 (areas of N2 Ice, CH4-rich areas and dark albedo areas due to tholins). They ran the model starting from 1988 and the model has a resolution of 170km. The model predicts an observable X_CH4 of 0.35% and this in the agreement of the ~0.5% from observational data by Lellouch et al (2011). The models predict methane cloud formation at the pole and that could be matching observed data from J. Cook who understanding his methane detection comes form cold parts of the atmosphere. He presented a model for cloud formation for 2015 and clouds do appear in the low, colder parts of the atmosphere. Their model will be made available to the community to use. They do not have a cold troposphere in their model.
Prediction for New Horizons. More CH4 ice deposits at the summer pole in 2015 than in 2010.
Who’d have known that that little cold world out there in deep, dark space, would have such a fascinating trip around the Sun? Data from New Horizons from its July 2015 fly-by of the Pluto System will literally confirm or refute all of these predictions. Then the models can be updated to reflect what summer will be like on Pluto in 2240.


