I am experimenting the WebGL 3D surface renders on this page and have had problems with very slow page loads in some browsers.
Wide range of Hygrometers:
DHT22, AM2302, AM2320, AM2321, SHT71, HTU21D, Si7021, BME280
Page Contents
Introduction
Previous experiments looked at comparing a set of six Aosong DHT22/AM2302 and compared the Aosong DHT22/AM2302 with the Aosong DHT11 and Sensirion SHT71. Here I have added five new devices meaning this test now covers most commonly available low-cost digital hygrometers. This page will present only new results. For details of how the experiment works, please refer to the previous write-ups.
The devices now included are:
- Aosong AM2302 (A.K.A. DHT22)
- Aosong AM2320
- Aosong AM2321
- Sensirion SHT71
- Measurement Specialties HTU21D
- Silicon Labs Si7021
- Bosch Sensortec BME280
The DHT11 is clearly a different class of sensor with substantially lower specification and has been dropped from further investigation. In my tests it performed perfectly well with respect to its specification, but I am only interested in devices that claim to read the full range 0–100% RH.
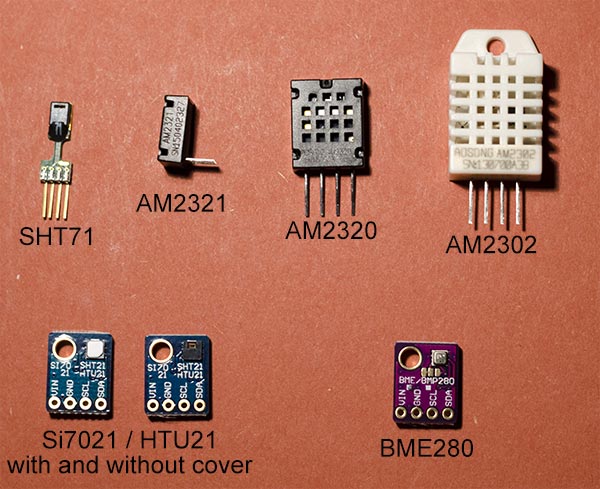
The Devices and Test Apparatus
Aosong AM2302
Also commonly known as DHT22. Two devices (E & F) from my previous experiments have been included. Device E was selected as the best of the six I originally started with. [AM2302 datasheet]
Aosong AM2320 & AM2321
The AM2320 is effectively the latest version of the AM2302 with the addition of an option to communicate over I2C interface. It is physically a little smaller, but with identical pin-out. The one-wire serial of the AM2302 is retained making this a simple drop-in replacement. [AM2320 datasheet]
The AM2321 appears to be the same but in a much smaller physical package and narrower pin pitch. It might be electrically identical. There is some suggestion from the manufacturer's web site that this might already be discontinued and replaced by AM2322. I am not sure. [AM2321 datasheet]
The sensing elements in these are likely the same as each other and I presume similar to the AM2302/DHT22. The internals of these devices are not exactly the same as the DHT22 because they do not exhibit the very distinctive sawtooth behaviour around 25°C.
Sensirion SHT71
The same device as was used in previous tests. [SHT71 datasheet]
Measurement Specialties HTU21D & Silicon Labs Si7021
I discuss these together though they are distinct devices from two different manufacturers. In normal use they are interchangeable both in terms of specification and communications protocols and even have the same I2C address so are drop-in replacements for each other. Similarly the Sensirion SHT21 (not included here) also has a near identical specification and interface. I have seen the same third party generic break-out boards being sold with any one of these devices attached. (See Figure 1.) The one difference I have found and possibly the only way to be sure which device you have is in the devices' unique serial numbers for which each manufacturer uses a slightly different format, detailed in their respective datasheets. So long as you do not attempt to read the device serial number, these three sensors function identically. That is not to say they will all perform identically. Though equivalent for most normal use, the precise specification details do differ, most particularly in their speed of response. [HTU21D datasheet, Si7021 datasheet]
An interesting feature of the SHT21, HTU21 and Si7021 is that they are available in options with or without a protective PTFE membrane over the sensing element. For this test I am running one device each, with and without. (See Figure 1.) The intent had been to include an identical pair of sensors with and without the cover, however when my devices arrived I found the retailer had sent me HTU21s without the cover and Si7021s with the cover. It was only by reading the internal serial numbers I was able to ascertain that. Though not discussed in detail on this page, the effect of using the protective cover on the response speed has been investigated elsewhere. My conclusion was that is has virtually no impact at all.
Be careful with variable types in your software. These devices can return humidity values <0% RH. This is a good thing because it allows some head room for small errors in the calibration. The first version of my code however used unsigned variables which caused numeric underflow and 0% ended up getting read as 3500%.
Bosch BME280
This device is a bit different. First, unlike all the other devices tested it includes a barometer. Though an interesting addition and I will write about it elsewhere, for the present report I present only the temperature and humidity data.
Second, it possibly works on an entirely different physical principle from the other sensors here. As far as I have been able to acertain, all the other devices are polymer capacitance hygrometers. The Bosch website, datasheet and press releases contain no information that I have been able to find about what is inside the BME280. Currently I am operating on a belief that it is a resistive sensor, measuring the electrical resistence through a porous film rather than the capacitance across a film like the other devices. Many thanks to Nava Whiteford who has sent me some scanning electron micrographs of what is inside the BME280. In those images, the lower die looks like a typical MEMS barometer so the upper die must presumably be the hygrometer and I am guessing that we see a pair of almost square electrodes and the device is measuring the resistence of the cracked film that spans between them.
The datasheet has no accuracy specification outside the range 20%<RH<80%, but my past experience from other Bosch Sensortec devices is that the specifications are rigourous and conservative. They seem to under-promise and over-deliver, so a priori I am not expecting problems outside the specified range. [BME280 datasheet]
As previously demonstrated for other sensors (DHT22, SHT71), driving this device too fast can lead to self-heating. Contrary to the other devices though, this can occur straight out of the box, in the factory default configuration. In its default configuration, rather than taking a reading on demand, the device continuously reads values as fast as it can, returning the latest available value on request. The sampling rate is controlled by setting the 0xF5 memory register and the various speed options are defined in the datasheet. When running at the default full speed my device returned temperatures 0.5°C warmer than when running at one sample per second. At one sample per second values agreed with the polled operating mode where the device was put to sleep between readings. For the present experiment speed is of no consequence and I operated at 1 sample/sec.
| Manufacturers' Specification | ||||||
| AM2302 | AM2320/AM2321 | SHT71 | HTU21D | Si7021 | BME280 | |
| Operating Range | 0–100 | 0–100 | 0–100 | 0–100 | 0–100 | 0–100 |
| Absolute accuracy (%RH, 25°C) |
±3% (10-90%) ±5% (<10, >90%) |
±3% (10-90%) ±5% (<10, >90%) |
±3% (20-80%) ±5% (<20, >80%) |
±3% (20-80%) ±5% (<20, >80%) |
±3% (0-80%) ±5% (>80%) |
±3% (20-80%) |
| Repeatability (%) | ±0.3 | ±0.1 | ±0.1 | - | ±0.025 | - |
| Long term stability (% per year) |
0.5 | 0.5 | 0.5 | 0.5 | 0.25 | 0.5 |
| 1/e Response (sec) | 5 | 5 | 8 | 5 | 18 (with cover) 17 (without) |
1 |
| Voltage supply (V) | 3.3–5.5 | 3.1–5.5(AM2320) 2.6–5.5(AM2321) |
2.4–5.5 | 1.5–3.6 | 1.9–3.6 | 1.71–3.6 |
The Test Apparatus
Apparatus setup is essentially as previously described though a new board had to be built to hold nine devices inside the jars. The AM2302 and SHT71 devices have proprietary one-wire serial interfaces and were addressed independently, each using a separate GPIO pin as in the previous experiments. All the other sensors were multiplexed onto the I2C bus. I2C is able to address multiple devices on a single bus so long as each has a different address, but since I have multiple samples of the same device I am not able to identify each one uniquely. I therefore use a TI CD4051 8x1 multiplexer so that only one of the devices is connected to the I2C bus at a time. The devices are powered continuously, but the I2C IO lines are briefly connected to each device in turn. This would not have been required if I had only one each of the different device models.
The reference calibration sources are the same as before, eleven saturated solutions and distilled water. Sensors were allowed to stabilise for a few hours with each solution. The software automatically steps the temperature over a pre-defined range, allowing the readings to settle at each temperature and logging a reading to a database before stepping to the next temeperature.
Results
Throughout the following plots you will notice the data for sensor G are a little more sparse than the others. Both my AM2320 devices fail intermittently above 50% RH, just returning bytes of 00 or FF. They are worst in the range 50-70% where I got almost no readings. Below that I had not problems and above they were intermittent but fine most of the time. I never found a cause or have any suggestion for why they should fail to produce output in such a narrow range of humidity. At least the values are obviously wrong and an extra function was added to the microcontroller code to simply reject the bad data. The others all continue uneffected but values were only logged from this sensor when they were sensible.
Similarly, the AM2321 device J failed to return values when the humidity was above 90%. Whenever I used H2O (100%) or K2NO3 (92%) the sensor would work for about 10-15min and then freeze, refusing to even repond to I2C communication requests. It worked again immediately once the humidity dropped. Again, I have not found a fix and simply did not log data from this sensor above 90%.
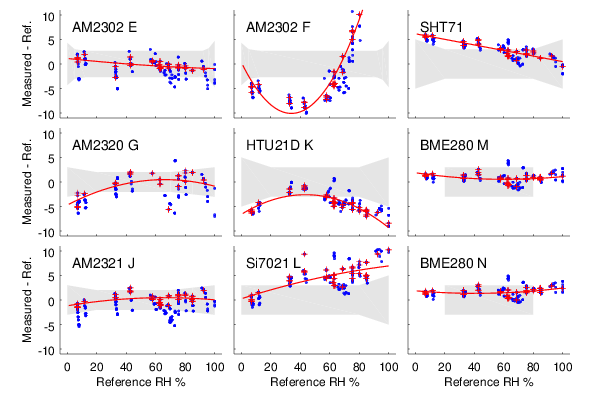
Part 1: As a Function of Humidity
First we look at the varying response of the sensors to different reference humidities 0–100%. Figures 3 and 4 contain the same data plotted with different axes. Figure 3 shows the actual relative humidity values measured and Figure 4 shows the deviations from a perfect calibration. The manufacturers' specifications are all defined at 25°C so I highlight those data in red. Data obtained at other temperatures are shown in blue.
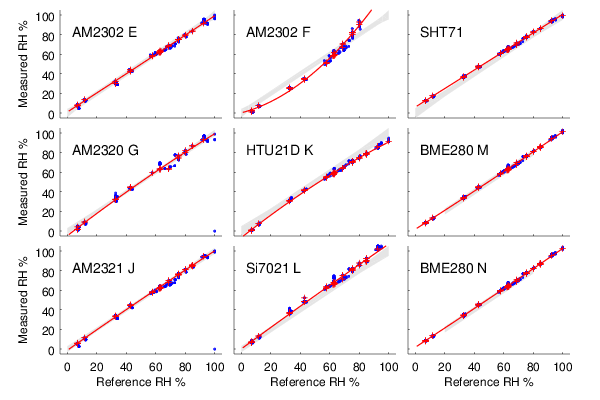
Both of the above figures have equivalents in previous test runs where you can see earlier results for SHT71 and AM2302 E, F. The other six are new and this is their first test.
Part 2: As a Function of Temperature
In Figure 4 the red data are measured at 25±1°C and the blue data at other temperatures. Device E (an AM2302/DHT22) performs very well at 25°C, easily achieving the advertised specification. The large scatter of the blue points however show that the calibration degrades rapidly with varying temperature. As previously noted, this is my cherry-picked, best AM2302 from a sample of six. In contrast, device K (an HTU21D) seems to lie just slightly outside its specified tolerance at 25°C but has the very substantial advantage of behaving consistently over temperature. In different applications, absolute accuracy at 25°C or a small temperature dependence might be preferable. Easily the best performers though are the BME280 which are both accurate and consistent over the range tested.
To show those differences in more detail I present plots for a single chemical as the temperature is systematically varied. Included are NaCl, NH4NO3 and MgCl. NaCl (RH∼75%) and MgCl (RH∼33%) conveniently span the range of commonly encountered humidity and both exhibit especially small thermal coefficients meaning the humidity should be almost independent of temperature. NH4NO3 lies between the other two (RH∼65%) and is included as a contrast because it is my one chemical with a strong intrinsic thermal coefficient. The humidity axis has been set to the same range in all three plots in order to fairly represent the relative gradients of the lines. Links are also provided to the equivalent three plots in the previous DHT22/DHT11/SHT71 comparison. Devices E, F and SHT71 are the same units there and here. They have remained fairly consistent over the six months between the two experiements.
- Figure 5 is sodium chloride. [DHT22/DH11/SHT71 version]
- Figure 6 is ammonium nitrate. [DHT22/DH11/SHT71 version]
- Figure 7 is magnesium chloride. [DHT22/DHT11/SHT71 version]
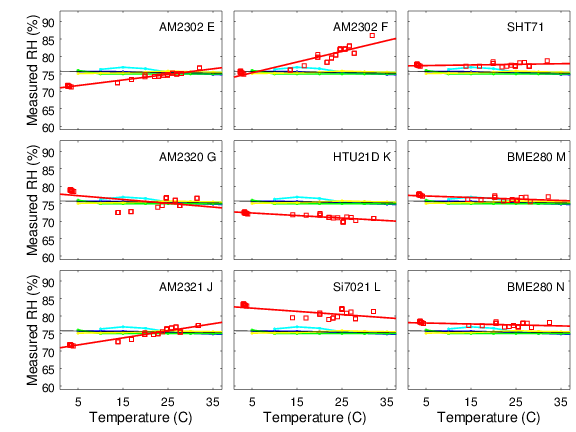
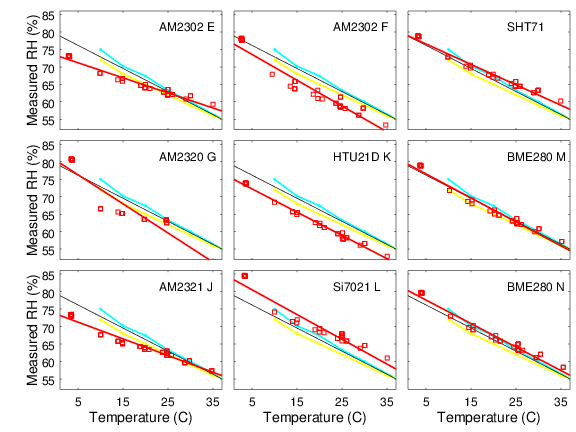
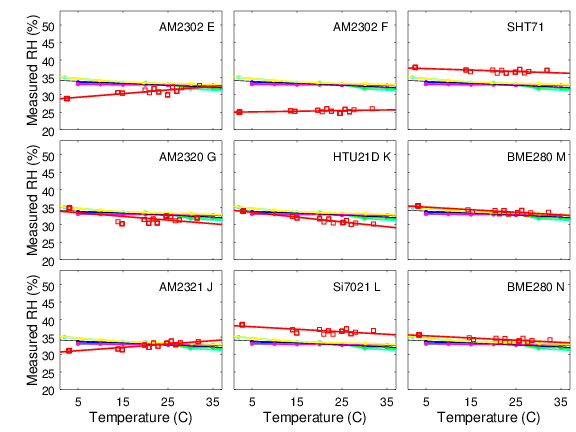
The BME280 shows outstanding calibration throughout. For the other sensors, where the slope of my data matches the slope of the reference data (e.g., NH4NO3 panel K), that device shows good thermal compensation and simply has a constant offset. Where the slopes of the measurements and reference data differ (e.g., MgCl panel K), the device is showing varying errors as the temperature changes.
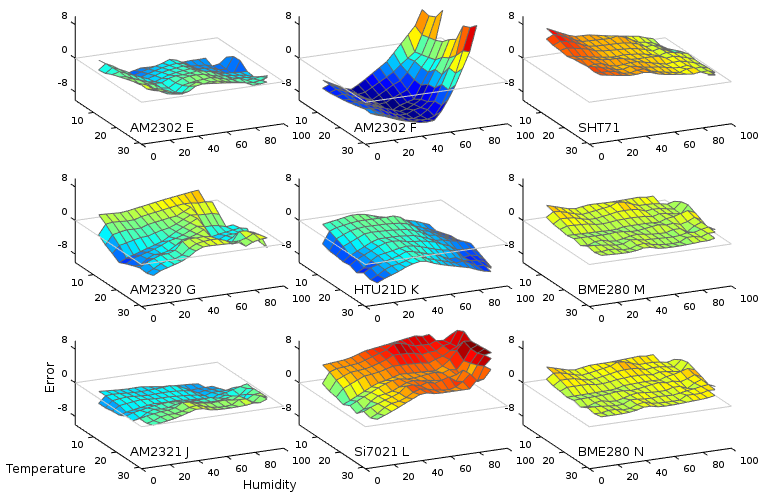
Part 3: As a Function Simultaneously of Temperature and Humidity
Finally, if a sensor is to be used to measure humidity under a range of varying temperatures a full bivariate calibration is required. Such a calibration over the temperature range 5 < °C < 35 is shown in Figure 8. The curves in Figure 4 are effectively cross sections through these surfaces.
Hysteresis
Hysteresis is the tendancy of a physical system's state to depend on its past state. The word is derived from ancient greek for 'lagging behind'. A sensor with hysteresis will tend to give low readings if it has recently been exposed to dry air and tend to read high when it has recently been exposed to wet air. Here I use the term hysteresis only to refer to the lagging of the sensor behind the current conditions. I do not distinguish between the case of the sensor having a very slow response (many hours) but eventually asymptotically approaching the 'true' value and the case of a sensor that is permanently biased by its history and would never reach the same 'true' value when approaching from above or below.
To test for this I held all sensors at a constant 25°C but exposed them in ordered sequence to K2NO3 (92%), NH4NO3 (60%), MgCl (33%), NaOH (7%), MgCl (33%), NH4NO3 (60%), K2NO3 (92%). Each humidity level was held for twelve hours and the measured value logged every half hour. Two complete cycles of the loop from wet to dry and back to wet were performed.
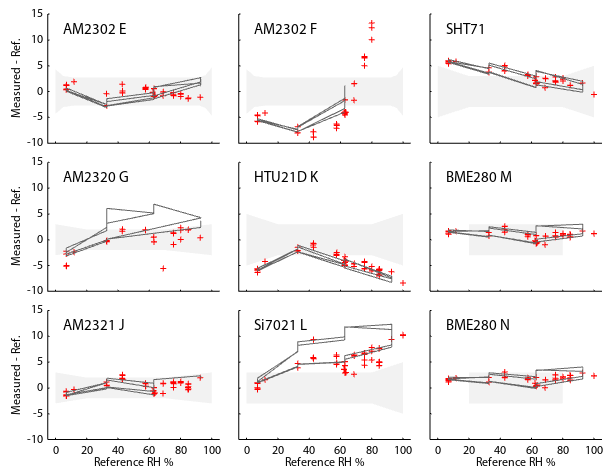
Figure 9 shows the hysteresis results. The red points are the same 25°C data as in previous plots. The dark grey lines are the new hystersis test and create envelope inside which all the readings will fall. As expected, all sensors do show the tendency to read systematically high when the humidity is decreasing and read low when humidity is rising. However, for all devices except the Si7021 and AM2320 the effect is small and the width of the envelope is not larger than the scatter of data points already observed. This means that with due regard to the errors already determined, hysteresis is not a signficant extra effect. It is already included in the errors we have observed. It is true though that all values will be slightly biases one way or the other as conditions change.
Temperature Accuracy
Though primarily interested in humidity, I present a brief comparison of the temperature measurements. I made no attempt here to establish an absolute temperature calibration and simply compare each sensor to the ensemble average of all nine sensors. A separate document covers absolute temperature calibration of the BME280 and also demonstrates that though the results here are strictly only relative, within a couple of tenths of a degree they are also good representations of the absolute accuracy.
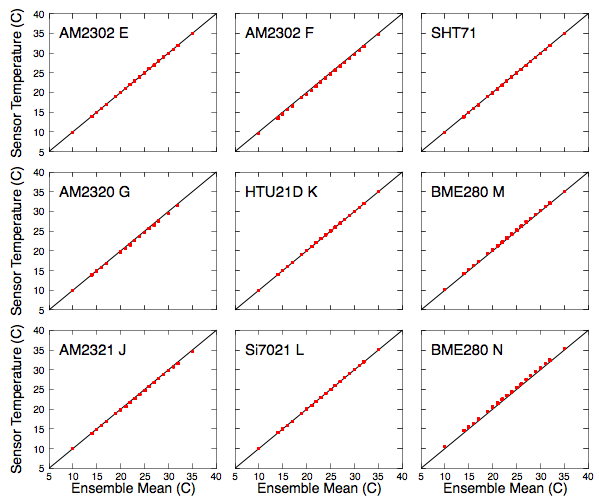
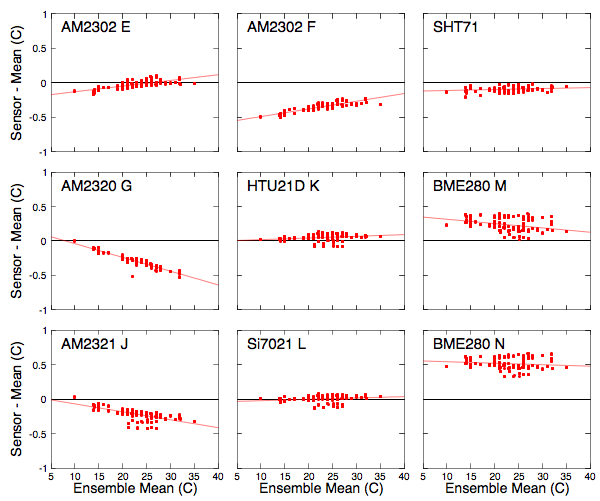
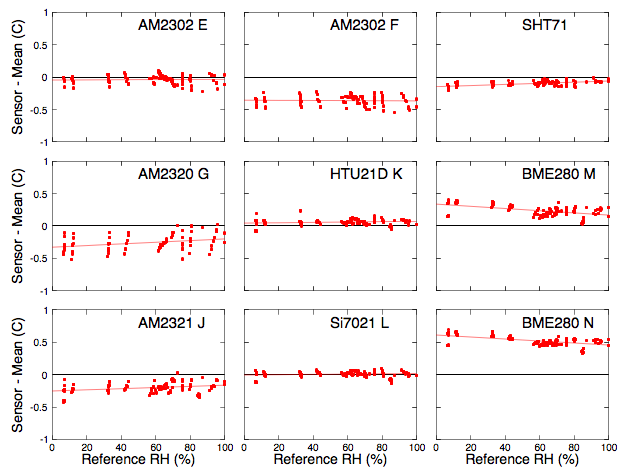
All agree within about 0.5°C. The Bosch sensors consistently gave the highest values and looking at Figure 10 show the largest scatter, suggesting poorer repeatability. However, investigating in more detail, the Bosch thermometers are very weakly humidity sensitive. Figure 11 shows an apparent scatter but replotting temperature errors as a function of humidity (Figure 12) shows a tight correlation with very little dispersion. Repeatability at a fixed humidity is very good. The difference is small (0.1°C) and well within the manufacturer's specification (1.0°C).
In contrast, the AM2320 (device G) shows little error as a function of humidity (Figure 12) but has the largest error as a function of temperature (Figure 11).
Response Speed
All respond to changes faster than humidity is likely to change naturally, but speed may occaisionally by an issue of interest, for example when measuring a forced flow of air.
Figure 13 shows the response of the devices as they are all exposed simultaneously to a sudden, upwards step-change in humidity and Figure 14 does the same for a downwards step. Readings were taken once every six seconds. For this test the BME280's internal smoothing filter was switched off. For all other data on this page the filter was enabled. It is a feature of all the AM23xx devices that they return a cached value from memory meaning they will always appear to respond to a change one reading (6 seconds) later than the others. For this reason I plot both the raw data where the AM23xx devices can all be seen to lag by one reading and also a version where that offset has been artifically removed. The left panel shows the actual results you would get when using the device and the right panel more directly compares the intrinsic physical response of the sensor elements.
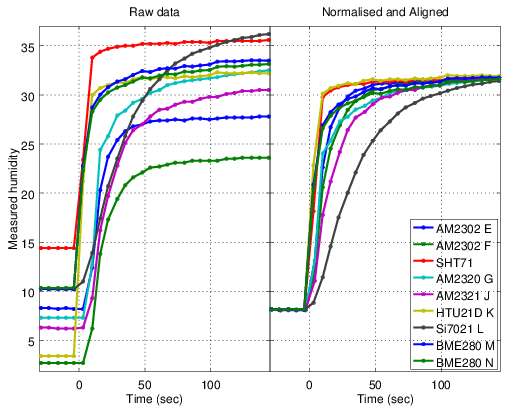
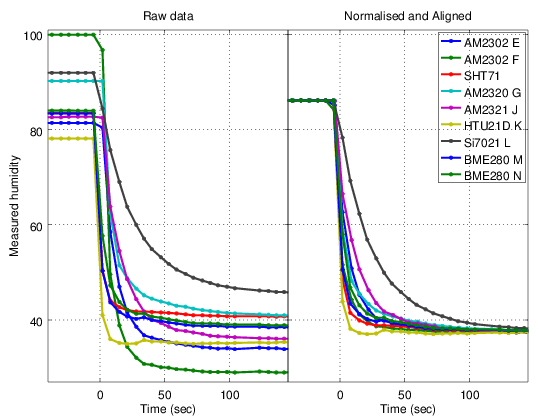
The HTU21D and SHT71 show the fastest response. Most of the others seem comparable to each other except the Si7021 which is the one major outlier. This is the device with a protective cover over the sensor and though it may seem reasonable that the membrane would slow the response, tests performed elsewhere showed it has almost no effect, slowing the devices readings by only about 1sec. The Si7021 is a lot slow slower than all the others, which I assume to be a deliberate design choice by the manufacturer to make the sensor insensitive to insignificant, rapid fluctuations in humidity and to better represent the wider prevailing conditions. For example, with the highly responsive HTU21D, I often see spikes and wobbles in the readings as I move around the room, stiring the air.
Commentary on Each Sensor
Update (March 2017): I have a major revision of these conclusions in preparation. There is still a long way to go and data collection is ongoing, but I want to be as open as possible. Newer tests have suggested that in my previous tests I got lucky with an excellent Bosch specimen but possibly had received a damaged Sensirion device. In the test described here, the BME280 was the clear winner, but I do not want anyone to interpret that as definitive or a general result. In my ongoing tests, the Bosch and Sensirion devices are indistiguishable at the limit of what I can measure. Work is still in progress.Bosch Sensortec BME280
Within the data obtained here, the BME280 is the undisputed winner. It is the most accurate at the specified 25°C and it shows the least dependence on temperature. The hysteresis curve traces a tight envelope and was highly repeatable on the two cycles performed. It is also the only model for which every device I own performs within specification. The difference is so stark that it leads me to believe the sensing element is in some way fundamentally different from the other devices. My current supposition is that it uses a resistive film rather than a capactive film.
These two particular BME280s consistently read a higher temperature than all the other devices, though others I have tested subsequently in my investigation of absolute thermometer accuracy have not all followed that pattern. I am not suggesting all BME280s read hot. They are the only devices tested to show a measurable humidity dependence in their thermometer. Again I wonder if this suggests fundamentally different sensor technology from the other devices. In any case, they fulfill the manufacturer's specified 1.0°C tolerance.
AM2302 (DHT22)
In line with previous tests, I would judge the accuracy of my devices to be around 5%. The hysteresis envelope is tight, though data are unfortunately not available at >90% for sensor F. Device E, cherry picked as the best from my set of six, has a calibration at 25°C that is almost the equal of any device tested, but it shows a significant temperature dependence when away from these ideal conditions. Over two years, three of the original six devices have failed.
AM2320 / AM2321
The devices I have tested appear similar to the DHT22 in overall performance, simply adding the convenience of I2C. Both my AM2320s exhibit the same intermittent fault of failing to return any data when humidity is in the range 50-70% RH. Oddly they appear to work reliably above and below that range. I never got to the bottom of whether this was something wrong in my set-up or an intrinsic sensor fault. Currently I am attributing it to bad luck in my getting a couple of faulty devices rather than a systematic fault with this model. Similarly the AM2321 intermittently fails to return a value above about 90% but works reliably at lower humidities. The AM2320 tested here shows quite a strong hysteresis though it is difficult to judge because of all the missing data points for NH4NO3 (60%).
In summary, they appeared similar to the DHT22 most of the time, but I had so many different intermittent problems I do not intend to use these devices in future experiments.
Sensirion SHT71
(See 'Update (March 2017)' above.) This run confirms my previous experiments with this device. Absolute accuracy seems comparable to the other sensors apart from the BME280. Thermal stability, which I think it often more important than absolute accuracy at 25°C, is better than most. The data scatter is small and the calibration error is linear in both the humidity and temperature directions. Looking at that the bivariate temperature:humidity surfaces, the SHT71 surface is nearly as 'flat' as the BME280s, but it is tilted. The hysteresis envelope was nice and tight. It seems well made and has not yet shown any problems in well over two years of continuous operation.
Apart from that linear tilt in the temperature:humidity surfaces, this device seems to perform very nicely, which makes me wonder if I simply have a poor device. A small adjustment to the internal calibration parameters could possibly bring this device to very nearly match the BME280. My current hypothesis is that the sensor element is contaminated and I have some experiments ongoing (March 2017) to investigate that.
Measurement Specialties HTU21D
I have nothing much specific to say about this, but I mean that in a good way. In my tests it did exactly what it was supposed to. The absolute errors were a little larger than advertised, but repeatability was good and the thermal dependence not too severe. Hystersis was almost undetectable. It is a nice compact and apparently robust unit, especially with the optional cover screen. It has a very rapid response, good if you need it, but will likely need filtering and smoothing if you are more interested in meteorological humidity. It can output values slightly >100 and <0 so long as you write your software to handle such values, which I like because it more honestly represents the limits on calibration accuracy. Devices which cap output at 0–100 makes it difficult to apply your own re-calibration near those limits.
This, the Si7021 and the SHT71 showed comparable errors overall. Each of these three sensors showed advantages in one paramter or another, but given that I am only testing one example of each I cannot say if those are features of the device type or just my particular specimen. My HTU21D exhibited good thermal stability and extremely low hysteresis.
Silicon Labs Si7021
I have nothing much specific to say about this, but I mean that in a good way. In my tests it did exactly what it was supposed to. The absolute errors were a little larger than advertised, but repeatability was good and the thermal dependence not too severe. It is a nice compact and apparently robust unit, especially with the optional cover screen. It has by far the slowest response to change (∼30sec) making it suitable for applications where you are not able to add your own digital smoothing filter and you are more interested in overall conditions rathter then transitory spikes. It can read out values slightly >100 and <0 as long as you write your software to handle such values, which I like because it more honestly represents the limits on calibration accuracy. Other device which cap output at 0–100 makes it difficult to apply your own re-calibration near the limits.
This, the HTU21D and the SHT71 showed comparable errors overall. My Si7021 is arguably the poorest of the three with larger thermal shifts and hysteresis, but given that I am only testing one example of each I cannot say if those are features of the device type or just my particular specimen.
Conclusion
The BME280 delivered easily the best results. The test is potentially unfair though given that they were brand new and are being compared against two-year old DHT22s and SHT71. I have not had much luck with reliability of the DHT22s, but the Sensirion SHT71 has proven itself dependable over two years so far.
If you have comments or suggestions feel free to contact me. robert -AT- kandrsmith.org
References: See here.
Acknowledgments
Though I designed and integrated the entire experiment, I must acknowledge the many open source projects, both software and hardware, that I used.
- Software was developed using the Arduino tools and environment, using some parts of the AdaFruit DHT22/DHT11 library, Brett Beauregard's PID library and Markus Schatzl and Carl Jackson's Sensirion library. Drivers for other sensors were based on datasheets and sample code published by their respective manufacturers.
- My data logger is EmonCMS from the Open Energy Monitor project.
- I am no longer using a JeeNode board, but am endebted to the work of Jeelabs for earlier iterations of this experiment.
- The plots and numerical analysis were generated in Flot, Octave, D3 and Plotly javascript.
- MySQL database, Apache web-server and of course the 10,000+ people who have contributed all across the Linux operating system.
- Javascript for the tabbed menu container around the 3D plots is from Online HTML Tools.
- Finally, thanks to the many correspondents for their interesting discussions and encouragement.
Almost vaguely related and possibly of interest is monitoring radon in the house.
2022-05-03 4:27 PM->