Interactive WebGL / Plotly version of Fig 8
Figure 8b. Surfaces showing deviation of each sensor from the true relative humidity as a function of temperature and humidity. A 'perfect' sensor would be a featureless green plane at zero. Blue shows low readings and red are high. The fits in Figure 4 are cross sections through these surfaces at T=25°C.
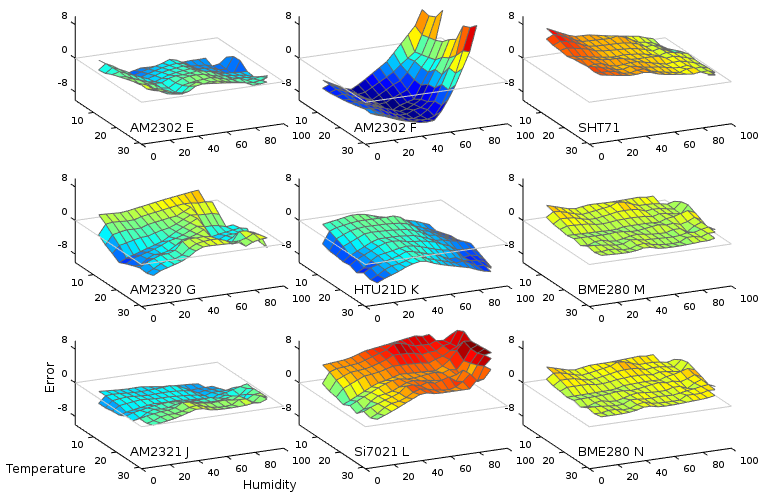
Figure 8. Surfaces showing deviation of each sensor from the true relative humidity as a function of temperature and humidity. A 'perfect' sensor would be a featureless green-yellow plane at zero. Blue shows low readings and red are high. The fits in Figure 4 are cross sections through these surfaces at T=25°C.